During the session there where quite a few general questions. This is Part 1.
Question:
can we add data range into the pivot?
Yes. If you use a formatted table as your data source when you add data to the formatted table the data will appear in the Pivot when you refresh. I demonstrated this in the session. If you don’t use a formatted table you need to manually extend the data source range.
Question:
You would probably run out of resources with excel and pivots and need to use power BI. What do you think the limits are? How many rows and columns to your data?
The session data set only had nearly 10,000 rows. You are not limited by the 1 million rows limit in a sheet. The data model in Excel can handle tens of millions of rows. It nis held in memory not on a sheet.
PivotTables can handle huge data sets. Pivots can access and report on external data sets with millions of rows.
Question:
If the dates are added to the columns or rows it normally can be automatically grouped into Months, Quarters and Years so it can sum by month, quarter or year. But sometimes it is not showing the month//quarter/year groups. Only specific dates are showing. How to fix this if it happens? Is it the issue with the format/date format of the original data and table?
You need to make sure the date column in your dataset only has dates in it. Not blank cells, not text that looks like a date. Text that looks like a date it the most common issue when the pivot doesn’t treat the date column like a date.
Question:
Can you count unique instances (e.g. unique invoice numbers) in a pivot table?
Yes, but you must use the Data Model which was not covered in the session. The Data Model has a Distinct Count option in the calculation that counts unique entries.
Question:
When you apply the timeline splicer to all pivots, how can you see what timeline is being used across all pivots?
This is an issue with all slicers that control multiple reports. I recommend either adding the Date column to the Filter section or using text box or a cell to have a message saying the report is filtered by a slicer in “XYX” sheet. You can also copy the slicer and place it in each of the other report sheets.
Question:
I have some data ranges to do pivot a certain Pivot table monthly. For data ranges, the number of rows may be less or more over months, how can I do the Pivottable one time for the first month and in the following months, I may update the Pivottable
I am not 100% sure I understand the question, but if you use a formatted table as the data source it can be longer or shorter and the Pivot will update correctly.
Question:
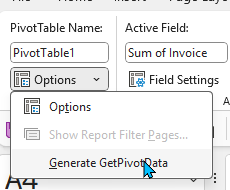
hi, when we select the cell in pivot table for formula, say cell C3 + C10, the formula looks strange. Anyway to go around it?
This is the GETPIVOTDATA function – it is turned on as standard. It allows you reference a cell based on its location in the PivotTable. You can turn it off and use the standard cell references. See image below. With the PivotTable selected on the PivotTable Analyse tab on the far left click the Options drop down and untick the Generate GetPivotData.
Question:
If referencing the pivot table totals into a separate reconciliation - can you advise the best way to reference these numbers given that they the pivot table is dynamic and may refresh and expand etc.
The GETPIVOTDATA function can handle some changes to the PivotTable layout if the fields used are not deleted. Unfortunately when the function is created all the entries are hard-coded. These can be replaced with cell entries to allows a more flexible formula.